Don't you have an account?
Register nowLogin your account
No problem!
Already have an account?
Login nowCreate an account
Research Article
Received: May. 04, 2025; Accepted: Aug. 11, 2025;
Published Online Sep. 28, 2025
Haitham Ramadan1,3 , El-Sayed Mansour1, Mahmoud Nasr1 , Mohamed Hager1, Tarek Fahmy1,2,* and Mohamed Zakaria1
1 Department of Chemistry, Faculty of Science, Alexandria University, Alexandria, Egypt
2 Alexandria Specialty Petroleum Products Company (ASPPC), Alexandria, Egypt
3 Sidi Kerir Petrochemicals Company (SIDPEC), Alexandria, Egypt
https://doi.org/10.62184/acj.jacj1000202521
© 2025 The Author(s). Published by Science Park Publisher. This is an open access article under the CC BY 4.0 license (https://creativecommons.org/licenses/by/4.0/)
· The performance of a gas-phase fluidized bed ethylene polymerization reactor is strongly optimized dependent on the particle size distribution (PSD) of chromium catalyst.
· The present work fills a notable gap in the industrial polymerization literature by systematically investigating how the particle size distribution (PSD) of the raw chromium-based catalyst affects the physical properties of the resulting polymer —including density, melt flow index (MFI), and polymer PSD—under realistic operating conditions. Unlike previous studies, which usually are conducted at laboratory scale or through computational modeling, this study presents data from a complete industrial process chain.
· For the high production rate of HDPE at SIDPEC, a moderate prepolymer rate of injection consumed the batch of prepolymer in five days, whereas a high injection rate consumed the same batch in three days only. Accordingly, producing HDPE with a moderate rate of prepolymer injection saved around 60% of each prepolymer batch for the PE line.
Ramadan, H., Mansour, E.-S., Nasr, M., Hager, M., Fahmy, T., & Zakaria, M. (2025). Optimization of supported chromium catalyst for enhanced production of high-density polyethylene. Advanced Carbon Journal, 111–121. https://doi.org/10.62184/acj.jacj1000202521
HDPE, Cr-Catalyst, Melt rheology, MFI, PSD.
The performance of a gas-phase fluidized bed ethylene polymerization reactor is strongly dependent on the hydrodynamic parameters, which in turn depend on the particle size distribution (PSD) of the chromium catalyst. This PSD has a broad range owing to the continuous feed of catalyst and removal of polymer products from the reactor. Herein, we investigate the effect of PSDs of a commercial raw Phillips Cr–SiO2 catalyst on the overall material and energy balances, reactor performance, melt flow index, density, and PSD of the final product in industrial-scale ethylene polymerization. This study recommends the use of raw Phillips Cr(III)–SiO2 catalyst with particle diameter (µm) specifications, as follows: 43.7 < D10 < 46.8; 100 < D50 <103, and 170 < D90 < 173. The percentage of fine particle fraction (<80 µm) should be in the range of 29.9%–31.6%. Implementing the defined PSD led to enhanced physical properties in the resulting high-density polyethylene (HDPE). Concurrently, the manufacturing process proceeded without problematic overheating or excessive prepolymer consumption, thereby increasing final product yield while reducing production cost
Graphical Abstract

1. Introduction
Polymers and polymer composites are extensively utilized in a vast array of technical applications, spanning both industrial processes and everyday consumer products. Polyethylene (PE), a chief member of the polyolefin family and the simplest polymer having the formula (–CH2–)n,accounts for approximately 34% of the world plastic market. This is due to its excellent properties, including ease of processing, low toxicity, chemical stability, corrosion resistance and good electrical insulation. [1] High-density polyethylene (HDPE), with densities around 930–970 kg/m3, [2] is one of the three basic commercial architectures of PE. It is a commodity semicrystalline material, i.e., interconnected crystalline and amorphous phases, with a high degree of crystallinity. HDPE is one of the most used plastics in the world market, attributable to its growing applications, particularly in the disposable packaging industry. [3] Moreover, HDPE is one of the largest-scale thermoplastics in the world, with macroscopic properties that are dependent on its structure and morphology. [4] Phillips catalyst, [5] is the branded industrial catalyst for olefin polymerization and the commercial catalyst for ca. 40–50% of the world’s HDPE. [6] It typically consists of chromium oxides mostly supported on silica or silica/alumina. This Cr/silica catalyst is typically prepared by impregnating a chromium (III) compound (Cr+3) onto a wide-pore silica. It is then activated by calcining in dry air or an oxygen environment, which converts the chromium in the hexavalent state (Cr+6). At that point, Cr(VI) reacts with surface hydroxyl groups to become anchored and monodispersed on the silica surface (Figure 1). [7]
Figure 1. Schematic representation of activation of Cr/SiO2 Phillips catalyst for ethylene polymerization.
The polymerization mechanism involving Phillips catalysts necessitates a pre-polymerization stage. This is because Phillips catalyst inherently lacks an initial alkyl ligand required for the initiation of the first polymer chain. This pre-polymerization stage is a common approach in industrial plants, performed at the commercial temperature range of 80–110 ˚C. The pre-polymerization stage includes: reduction of Cr(VI) by monomer to a lower valence, mainly Cr(II); desorption of the organic oxygenated redox by-products; and the development of an alkyl or hydride ligand, into which ethylene is later inserted. Additionally, the existence of strong adsorbent or Lewis-acidic carrier, such as zeolites or alumina treated with halide, is believed to significantly boost the activity of the Cr/silica catalyst, whereas a co-catalyst of (Me)2Al–Cl is used to avoid the induction time of little or no activity at startup. The prepolymer is also treated with n-hexane to enhance its porosity and remove low molecular weight polymer (wax). It is well known that the kinetics of Cr/silica catalyzed polymerization can be manipulated by altering temperature and ethylene concentration. Several proposals have been introduced for subsequent ethylene polymerization initiation from the isolated catalytically active Cr(II) sites. [8] Chain growth that follows initiation is most often thought to proceed through a coordination mechanism by insertion of coordinated monomer into a Cr–alkyl bond.
Among different operating conditions of the reactor, HDPE is recurrently produced via gas phase polymerization process using a fluidized bed reactor (FBR), a process based on the polymerization mechanism of Phillips processing technology. The FBR for gas phase olefin polymerization was adopted by Dye [9] whose patent was filed in 1957. In this process, pre-polymerization is carried out in continuous-stirred tank reactors (CSTR), in a loop reactor, in a hollow shaft reactor, or in a batch reactor, positioned before the FBR. Catalyst particles, along with ethylene and comonomer, are fed into the CSTR to yield pre-polymerized catalyst (prepolymer). Afterwards, these pre-polymerized catalyst particles (20-80 µm) are continuously introduced into the FBR. Here, they react with the incoming fluidizing gas (monomers) entering from bottom to complete the ethylene polymerization, forming a polymer powder with a broad particle size distribution (PSD) in the range of 100-2000 µm. Unlike conventional gas phase reactor operation, the two-stage polymerization process with the inclusion of a pre-polymerization step eliminates the risk of forming hot spots and agglomerates in the initial phase of polymerization. [10] The two-stage polymerization process is also advantageous in controlling polymer particle size and catalyst activity in the fluidized bed reactor, as the prepolymer is fed into the FBR after being created in a separate pre-reactor.
Polymers produced using Phillips catalyst typically exhibit the broadest molecular weight distribution (MWD). Their polydispersity index (PDI)–defined as the ratio of weight-average molecular weight (Mw) to the number-average molecular weight (MN)– ranges from 4.0 to over 100 in final product [11], a broad range reflecting the multiplicity of active-site types present in the catalyst. This broad MWD excels in many commercial applications requesting the distinguishing rheological characteristics of HDPE produced with Phillips catalyst, namely “shear thinning” and “melt strength” properties. The former property means that the polymer flows more easily under shear making the polymer easily extruded at high shear rates, but extruded parts subsequently resist the distortion of gravity at low shear rates. Generally, it is a well-known fact that the MWD is adjustable by choosing the (a) catalyst type, (b) activation temperature, (c) cocatalyst type, and (d) cocatalyst amount. [12] Melt polymer characteristics such as viscoelastic and melt density are extremely important properties in processing polymer, including rotational molding, compression molding, extrusion, blow molding, injection molding, fiber melt extrusion, 3D-printing, blown film and many more. Rheological characteristics are dictated by the chain architecture of the polymer. Long-chain branching (LCB) often dominates the rheological behavior, where LCB should have a minimum length of about 150 carbons to have rheological significance to the performance of many HDPE grades during commercial molding operations. [6] Therefore, rheology plays an important role in creating a relationship between a given polymer structure, the processing properties and the final quality and properties for a given product. [13, 14]
During production, the melt flow index (MFI), as an inverse measure of the polymer melt viscosity, is used as an indicator of the breadth of the MWD and processability of polymer. MFI is dependent not only on the molecular weight but also on the molecular shape, including branching content. [15, 16] Commercially, MFI is adjustable by several key reaction variables including reactor operating conditions and the feed composition. The foremost among these are the reaction temperature and ethylene concentration. Density (D) is also measured to reflect the degree of branching. This is because branching disrupts the polymer's crystallinity, which typically has a density of ca. 1.0 g mL–1. Branching instead forces more of the polymer into an amorphous form, which possesses a lower density of about 0.87 g mL–1. Given that co-monomer (1-butene or 1-hexene) to monomer (ethylene) concentration ratio governs polymer branching, then the polymer density is controlled by adjusting the amount of 1-hexene or 1-butene fed to the reactor. Explicitly, polymer density could be lowered by increasing the 1-hexene concentration or by reducing the ethylene concentration. [12] Generally, commercial PE grades are customarily sold by density and MFI, with the latter being more consistent and easily measured in polymer manufacturing environment. Though chromium-based catalysts have been known since their discovery by Hogan and Banks at the Phillips Petroleum Company in the 1950s, numerous efforts have aimed at improving them. A 2007 patent by Philippe et al., [17] describes a method for preparing HDPE with broadened MWD, good environmental stress crack resistance (ESCR), high impact resistance and good processability. This method involves using a Cr catalyst on a silica-based support characterized by a relatively low specific surface area to Cr content ratio. Furthermore, a titanium compound is deposited on the support to achieve a specified support surface area to final titanium content ratio, combined with the use of elevated activation temperatures. A 2018 patent issued to Kapur et al. [18] reported PE produced utilizing a chromium oxide catalyst. This PE contained approximately 95 wt% ethylene-derived units, with a density ranging from 0.930 to 0.945 g cm–3 and a melt index of 10 to 20 gm/10 minutes.
Although elevating the temperature beneficially increases MFI and enhances catalyst activity by decreasing induction time, it is not an optimal solution for increasing polymer production rate on a commercial scale. One of the disadvantages of gas phase polymerization is the existence of an upper bound for the reactor operating temperature, that must remain below the melting point (softening point) of the polymer produced. [10] When the softening temperature of the polymer is reached, the polymer particles begin to agglomerate and stick to reactor walls, thus forcing the reactor to shut down. Owing to the lower ability of the gas to dissipate the heat of reaction, the particle size of the catalyst is crucial in fluidized-bed reactor. Performance of the reactor is also strongly dependent on the hydrodynamic parameters including minimum fluidization velocity, size of gas-solid mass and heat transfer coefficients, which in turn, depend on the PSD. [19] As mentioned, this PSD exhibits a broad range owing to the continuous addition of catalyst and removal of products from the polyethylene fluidized bed reactor.
Significant research efforts have been dedicated to modeling and simulating gas-phase olefin polymerization in fluidized-bed reactors, with the aim of investigating temperature control challenges and predicting system stability. [20-24] However, most existing models that simulate product properties and reactor performance frequently assume uniform PSD and a constant polymer particle diameter. [25-27] Furthermore, a complete mathematical model for an industrial scale, having the capability to predict the targeted properties of the final product, requires a clear understanding of the physicochemical phenomena at multiple length scales. This includes the macroscale which encompasses the overall material and energy balances, reactor performance, the product PSD, and any inhomogeneities in the final product. [2, 28] In this context, the present work fills a notable gap in the industrial polymerization literature by systematically investigating how the PSD of the raw chromium-based catalyst affects the physical properties of the resulting polymer —including density, MFI, and polymer PSD—under realistic operating conditions. Unlike previous studies, which are usually conducted at laboratory scale or through computational modeling, this study presents data from a complete industrial process chain. Specifically, we report results from a series of full-scale experiments encompassing three manufacturing stages: (1) activation of six raw catalyst PSD variants in a fluidized activator reactor, (2) pre-polymerization in a batch reactor, and (3) final polymerization of HDPE in an industrial fluidized bed reactor. Furthermore, the interdependence of various particle distributions –from starting catalyst and activated catalyst to prepolymer and final polymer– revealed by this work can be further leveraged to accurately assess reactor operating variables and the targeted properties of produced polymers in both academic and industrial research.
2. Experimental
2.1. Materials and methods
Ethylene (99% purity) and 1-butene (99.8% purity) used in the experiments were provided by C2/C3 steam-cracking unit at Sidi-Kerir Petrochemicals Co., Alexandria, Egypt. Raw Chromium Cr(III) catalyst supported on silica (available under the trade name PQC Chromium catalyst), with six different particle size distributions, was purchased from PQ-Kansas City. Activation of series of raw Cr-catalyst with six different PSD was performed in a fluidized bed activator (FBR Activator Vessel). Approximately 410 kg of the raw catalyst was heated to 150˚C in an inert atmosphere at a ramp rate of 1.5 ˚C/min and maintained at this temperature for ca. 45 min. It was then heated to 320 ˚C at the same ramp rate and holding time, followed by exposing the Cr-catalyst to an oxidative atmosphere until a third temperature (550˚C) was reached and held for 300 min. This process also enhanced dehydroxylation of the surface for improved catalyst performance, in both the one-step and two-step activations. Finally, the activated catalyst was cooled to 50˚C under inert an atmosphere for 240 minutes.
Prepolymerization was subsequently performed in an Autoclave batch reactor. Six batches of activated catalyst were employed for six polymerization experiments. To the reactor, about 4 tons of n-hexane, 15 kg of tri-n-octylaluminum TnOA, 360 kg of activated catalyst, 0.5 kg of anti-static agent, and the rest of n-hexane (6 tons) were added at ambient temperature with a slow stirring. The reactor was then heated to 68˚C, and ethylene gas was injected at a low rate until it reaches its maximum of 400 kg/hour. The reaction temperature was maintained at 72 ˚C for 8 hours until the entire 3 tons of required ethylene had been injected. Reaction conditions were then held constant for 30 minutes, after which stirring was stopped to allow the waxes (short-chain prepolymer) to exit the reactor. The prepolymer formed was extracted by adding n-hexane and anti-static and lowering the temperature to 40˚C.
Polymerization was finally performed in a Unipol gas-phase fluidized-bed reactor. The prepolymer was continuously injected at a variable rate (70-150 injection/hour) and variable reactor temperature (108.5-110.8˚C). These parameters were adjusted based on the raw catalyst’s PSD and the desired final product properties. Other parameters, such as the amount of co-monomer and ethylene gas flow into the reactor, were kept fixed. The polymerization was completed by a mixture gases flowing from the bottom of reactor, containing ethylene (monomer), but-1-ene (comonomer), nitrogen and triethyl aluminum (TEA).
2.2. Characterization of polymer
The polymers obtained from the six experiments were tested as follows: the MFI of polymer was measured on a Zwick/Roell 4106 Extrusion Plastometer, adhering to ASTM D1238 (MFI21). This standard corresponds to a measurement at 190°C under a polymer load of 21.6 kg, with results reported in gm/10 minutes. Density (D) was measured using a Density Gradient Column (DGC), in accordance with ASTM D1505, and reported in kg/m3. The PSD of catalyst, prepolymer and polymer powder samples were determined using a Mastersizer 3000 (Malvern Panalytical, Worcestershire, UK) via the laser size diffraction (LSD) technique. The light scattering routine for PSD measurement followed the ASTM B822 standard. Sieving (ASTM B214 standard) was also employed in polymer powder PSD measurements using a Retsch Sieve Shaker (Model No: AS200 Basic) equipment to separate particles which are over 1.6 mm; the remaining powder was then analyzed by Mastersizer 3000. The purity of ethylene and but-1-ene gases was detected using a gas-chromatography/flame-ionization-detector (GC/FID) system, specifically a Hewlett Packard type 6890 (G1530A, Hewlett Packard, Germany). The thermocouple model RMUN is used for detecting the temperature of the fluidized bed reactor. This transducer converts thermal energy into electrical energy through a junction formed by joining dissimilar metal wires. Voltage is produced proportional to the temperature change at this junction. Its main specifications includes an element of Pt 100 ohm at 0oC, a nipple size of 27.2 mm, and a nipple length of 150 mm.
Pre-polymer injection rate into Fluidized Bed Reactor is controlled by a dosing valve system “Dog clutch”. This system utilizes Type 150 NPS trunnion-mounted ball valves, each with an effective ball cavity capacity yielding a dosing cup volume of 1.5 litters. The injection system consists of four valves arranged in two pairs. Within each pair, the dosing valves operate 180o out of phase from the other. This dephasing of dosing valves provides an even injection of pre-polymer into the reactor. The valves in operation are selected by means of the clutches, in normal operation one pair of valves is rotating and the other pair is on standby. During each valve revolution, a valve is filled with pre-polymer, then rotates to discharge the pre-polymer into the reactor. Each fill delivers 0.5 Kg of pre-polymer, allowing the system to precisely control the hourly injection rate by adjusting the valve's operation. All the above experiments are proceeds in both polymerization production unit and laboratories of SIDPEC.
3. Results and discussion
Several parameters can control the final step of polymerization reaction to attain distinctive featured PE powder, for instance, the amount of injected prepolymer into the reactor, temperature, quantity of co-monomer and applied flow of ethylene gas. For our six experimental samples, we fixed the co-monomer amount and ethylene gas flow. The variable parameters were the reactor temperature and the amount of injected prepolymer. This study investigates the effect of six different raw catalyst PSD on polyethylene powder manufacturing. The PSD profiles selected are representative of the acceptable industrial window. This allowed us to assess the effect of varying PSDs while keeping the catalyst chemistry and composition constant. We traced this effect through a series of industrial-scale polymerization experiments to identify an optimal raw catalyst PSD of raw catalyst that improves the final product’s properties, including economic impact. The present work aims to determine the optimal PSD for the crude Cr(III) catalyst, that initiates HDPE polymerization. This optimization seeks to achieve an appropriate MWD and the best match for the polymer's targeted final properties, all while avoiding the need to elevate the reactor temperature close to the melting temperature (M.P=110˚C) or consume excessive amounts of prepolymer.
Table 1 and Figure 2 lists and displays the corresponding PSD (μm) parameters expressed in D10, D50, D90 and MPS for raw catalyst Cr(III), activated catalyst Cr(VI), prepolymer and polymer of HDPE. The parameter Dv(50)% (D50) is defined as a particle diameter, with 50 wt% of particles having a smaller diameter and 50 wt% of particles having a larger diameter. [17] Similarly, D90 and D10 are defined as a particle diameter below which 90 and 10 wt% of particles is comprised of smaller diameter, respectively. The D10, D50, and D90 values for each catalyst batch were selected in accordance with typical industrial specifications for commercial Ziegler–Natta catalyst systems used in HDPE production The parameter (<80 µm) represents the percent of particles in the sample having a smaller diameter than this value, while mean particle size (MPS) is the mean particle size of the population, typically near the peak of the distribution. The trends illustrated in Figure 2 indicate that the raw catalysts D10 value significantly influences the PSD evolution in downstream products. Samples with D10 in the range of 43.7–46.8 µm showed relatively stable and moderate increases across the Cr(VI), prepolymer, and HDPE stages. This could be attributed to striking a balance between maximizing particle-matrix interaction while concurrently preserving favorable processing attributes. Such optimization usually leads to superior mechanical strength due to better load transfer, in addition to improved stability, thereby enhancing the end-use performance of polymer composites. In contrast, sample 3 (D10 = 27.2 µm) exhibited rapid PSD reduction, potentially due to particle attrition or agglomeration during fluidized activation.
Table 1. Particle Size Distribution (PSD) parameters (D10, D50, D90) of raw catalyst [Cr(III)], activated catalyst [Cr(VI)], prepolymer, and final HDPE polymer.
|
|
Manufacturing Step |
PSD (µm) |
Sample#1 |
Sample#2 |
Sample#3 |
Sample#4 |
Sample#5 |
Sample#6 |
|
1 |
Cr+3 |
Dv(10)% |
47.40 |
46.20 |
27.20 |
46.80 |
48.30 |
43.70 |
|
Dv(50)% |
99.8 |
100 |
98.4 |
103 |
103 |
101 |
||
|
Dv(90)% |
162 |
173 |
169 |
172 |
169 |
170 |
||
|
<80 |
30.95 |
30.6 |
34.22 |
29.96 |
29.02 |
31.65 |
||
|
2 |
Cr+6 |
Dv(10)% |
27.10 |
25.60 |
11.40 |
26.10 |
27 |
16.30 |
|
Dv(50)% |
103 |
99.3 |
73.2 |
98.2 |
101 |
93.3 |
||
|
Dv(90)% |
177 |
170 |
157 |
170 |
172 |
167 |
||
|
<80 |
30.91 |
33.81 |
34.2 |
34.72 |
32.11 |
39.69 |
||
|
3 |
Prepolymer |
Dv(10)% |
43.50 |
82.90 |
75 |
80.30 |
69.80 |
33.20 |
|
Dv(50)% |
144 |
161 |
156 |
158 |
157 |
125 |
||
|
Dv(90)% |
265 |
285 |
276 |
276 |
275 |
271 |
||
|
<80 |
19.27 |
9.04 |
11.10 |
9.90 |
12.5 |
28.01 |
||
|
4 |
HDPE |
Dv(10)% |
320 |
218 |
289 |
320 |
374 |
885 |
|
Dv(50)% |
807 |
642 |
821 |
1010 |
1030 |
1530 |
||
|
Dv(90)% |
1780 |
1550 |
1850 |
2130 |
2130 |
2570 |
||
|
<80 |
0.03 |
0.71 |
0.39 |
0.03 |
0.22 |
0.04 |
||
|
MPS |
807 |
642 |
821 |
1010 |
1030 |
1530 |

Figure 2. Comparison of D10, D50, and D90 values across the PSD profiles of raw catalyst [Cr(III)], activated catalyst [Cr(VI)], prepolymer, and HDPE polymer.
Table 2 and Figure 3 show the effect of different PSDs of Cr (III) on the physical properties, namely MFI and density of the polymer powder after the first injection of prepolymer until the total injected volume. Table 2 also shows the standard targeted properties of polymer powder, which are MFI of 9.1–12 gm/10 min and density of 946–950 kg/m3. Moreover, operational conditions, including prepolymer injection rate per hour and rector temperature, were also recorded from the start to the completion of the melting process. The standard temperature of reactor during polymerization is 108–109 ˚C. For efficient total production cost, the upper bound to the operating reactor temperature must remain below the polymer’s melting point (110 ˚C). Exceeding this limit, can lead to agglomerate formation, which necessitates reactor shut down for maintenance, thus impacting cost-effectiveness. In particular, each shut down caused by elevated reactor temperature and problematic agglomerates reduces the powder production down by 4.5%. Similarly, increasing the prepolymer injection rate and consumption beyond the moderate rate of 70–80 inj/hour, which is typically intended for pursuing milder reactor temperatures, significantly increases the production costs. For high production rate of HDPE at SIDPEC, a moderate prepolymer rate of injection consumed the batch of prepolymer in five days, whereas a high injection rate consumed the same batch in three days only. Accordingly, producing HDPE with a moderate rate of prepolymer injection saved around 60% of each prepolymer batch for the PE line.
As presented in Table 2 and Figure 3, using raw catalyst of sample number 1 produced polymer that is characterized by MFI of 13 gm/10min and density of 947-949.5 kg/m3. This was achieved by consuming an excess amount of prepolymer 150 inj/hour at moderate reactor temperature of 108.5 ˚C. Regarding sample number 2, to produce polymer with MFI of 12.5 gm/10min and density of 947-950 kg/m3, a moderate injection rate of prepolymer 75 inj/hour and moderate temperature of 108.5 ˚C were employed. Produced polymer from raw catalyst of sample 3 showed low MFI of 9 gm/10min and density of 946.5-947 kg/m3 by consuming an excess amount of prepolymer (130 inj/hour) at 109.5-110 ˚C.
A higher MFI of 11 gm/10 min with density 946.5-948 kg/m3 reduced the consumption of prepolymer (80–100 inj/hour) but elevated the reactor temperature up to 110.5–110.8 ˚C. Because of elevated temperature, different masses of lump were formed up about four times per year with ca. 17.8% lost days. Considering sample number 4, a high MFI of 11.5 gm/10 min and density of 947-948 kg/m3 were attained by consuming a moderate amount of prepolymer (75 inj/hour) at moderate operating reactor temperature (108.5 ˚C). Polymerization using the raw catalyst of sample number 5 accomplished MFI of 9.4 gm/10 min and density of 946.6-947 kg/m3 through high injection rate of prepolymer (105 inj/hour) at 109 ˚C. For sample number 6, a polymer with high melt index of 11 gm/10min and density of 946-948 kg/m3 was produced by consuming a moderate amount of prepolymer (70-80 inj/hour) at a moderate reactor temperature (109.25-109.5 ˚C). The significantly high fraction of HDPE fine particles <80 µm (0.71, Table 1) in sample 2 indicates incomplete particle growth within the reactor. This is in line with the lowest D10, D50 and D90 values.
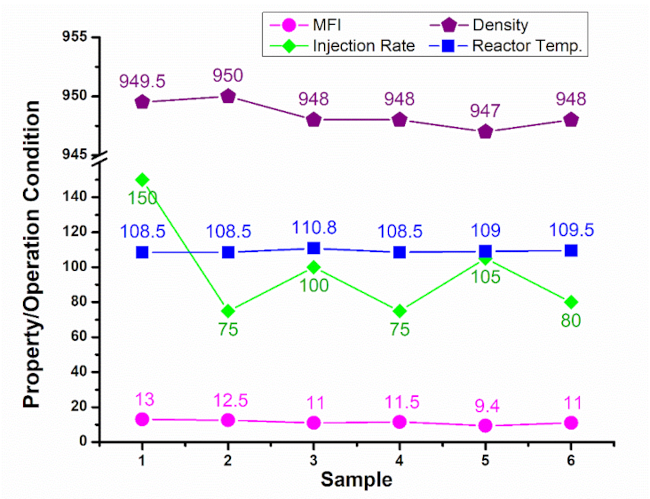
Table 2. Impact of six distinct Cr(III) catalyst PSDs (based on D10 values) on HDPE melt flow index, density, and gas-phase reactor parameters.
| Samples (D10 of Cr+3)
| Sample#1 (47.40 µm) | Sample#2 (46.20 µm) | Sample#3 (27.20 µm) | Sample #4 (46.80 µm) | Sample#5 (48.30 µm) | Sample#6 (43.70 µm) |
1. | MFI : load 21.6 Kg (gm/10min)a | 8.1–13 | 10–12.5 | 7–9 or 9–11 | 9.8–11.5 | 7.7–9.4 | 9–11 |
2. | Density (kg/m3)b | 947–949.5 | 947–950 | 946.5–947 or 946.5–948 | 947–948 | 946.6–947 | 946–948 |
3. | Injection Rate (inj/hour)c | 150 | 75 | 130 or 80–100 | 75 | 105 | 70–80 |
4. | Reactor Temperature (˚C)d | 108.5 | 108.5 | 109.5–110 or 110.5–110.8 | 108.5 | 109 | 109.25 or 109.5 |
a Manufacturing standard range is 9.1–12 gm/10 min
b Manufacturing standard range is 946.8–952.8 kg/m3
c Manufacturing standard range is 70–80 inj/hour
d Manufacturing standard range is 108–109˚C
Figure 3 and 4 demonstrate that sample 2 (D10 ~46.2 µm) displayed a balanced profile including: (1) moderate MFI (12.5 g/10 min), which favors good flowability and processability; (2) highest polymer density (950 kg/m³), indicating good polymer packing and mechanical integrity; (3) low injection rate (75 inj/hour) and hence minimum consumption of material; (4) operating at a low reactor temperature (108.5 ˚C), which contributes to improved process stability, and energy efficiency. This advocates that the large fraction of fine particles in sample 2 is not inherently a disadvantage; instead, combined with its other characteristics, it results in balanced performance, good process stability, and superior material quality. For the measured samples (1, 3 and 5), achieving MFI > 9.1 gm/10 min required increasing the rate of injection of prepolymer and/or elevating temperature of the reactor. Overall, the present study confirms that during polymerization process, the physical properties including MFI, density and PSD of the produced HDPE polymer is highly dependent on the selection of specific PSD of the crude catalyst Cr(III) particles.

Figure 4. Relation between D10 of raw catalyst Cr(III), the injection rate and the obtained properties (melt flow index (MFI) and polymer density) for HDPE product.
4. Conclusions
In this study, an industrial ethylene polymerization using six selective PSDs of Phillips Cr-catalyst was reported. The study suggests the interdependence among such PSDs of the initial raw catalyst, activated catalyst, prepolymer and final polymer. This interdependence, furthermore, significantly influences the physical properties of the produced polymer and the corresponding operational conditions. Particularly, to improve flow and density properties of HDPE without agglomerations problems or high consumption of the materials, we recommend raw catalyst Cr(III) with the following specifications: (1) the particle size below which 10% of the sample volume lies (D10) should range from 43.7 µm to 46.8 µm; (2) the median particle size, where 50% of the sample volume is below this value (D50) should be between100 µm and 103; (3) the particle size below which 90% of the sample volume lies (D90) should fall within 170 µm to 173 µm; (4) the diameter of fine particles (<80 µm) should be between 29.96 µm and 31.65 µm.
Acknowledgments
The authors extend their appreciation to Mohamed Ibrahim, Chairman and Managing Director, Mahmoud Saad, General Manager of Polyethylene Laboratories, and Mohamed Elshamy, General Manager of Polyethylene Operations, in Sidi Kerir Petrochemicals Company (SIDPEC) (Alexandria, Egypt) for facilitating using the industrial reactors and measurement equipment in this research.
Conflict of Interest Statement
The authors declare that they have no conflicts of interest.
Funding Statement
This manuscript received no external funding.
Data will be available upon request.
[1] Khanal, S., Lu, Y., Dang, L., & Xu, S.-A. (2021). Improving the flame retardancy of intumescent flame retardant/high-density polyethylene composites using surfactant-modified montmorillonite clay. Journal of Applied Polymer Science, 139(15), 51940. [Crossref] [Google Scholar]
[2] Thakur, A. K., Gupta, S. K., & Chaudhari, P. (2022). Slurry-phase ethylene polymerization processes: A review on multiscale modeling and simulations. Reviews in Chemical Engineering, 38(5), 539–568. [Crossref] [Google Scholar]
[3] Cruz, S. (2003). Evaluation and identification of degradative processes in post-consumer recycled high-density polyethylene. Polymer Degradation and Stability. [Crossref] [Google Scholar]
[4] Ushakova, T., Starchak, E., Krasheninnikov, V., & Novokshonova, L. A. (2021). In-reactor blends based on ultrahigh molecular weight polyethylene: Effect of microstructure of modifying fraction on the morphology and viscoelastic behavior of blends. Journal of Applied Polymer Science, 139(16), 52000. [Crossref] [Google Scholar]
[5] Hogan, J., & Banks, R. (1958). Polymers and production thereof (U.S. Patent No. 2,825,721). U.S. Patent and Trademark Office. [Google Scholar]
[6] McDaniel, M. P., Rohlfing, D. C., & Benham, E. A. (2003). Long chain branching in polyethylene from the Phillips chromium catalyst. Polymer Reaction Engineering, 11(2), 101–132. [Crossref] [Google Scholar]
[7] McKenna, T. F., & Soares, J. B. P. (2001). Single particle modelling for olefin polymerization on supported catalysts: A review and proposals for future developments. Chemical Engineering Science, 56(13), 3931–3949. [Crossref] [Google Scholar]
[8] Delley, M. F., Conley, M. P., & Copéret, C. (2014). Polymerization on CO-reduced Phillips catalyst initiates through the C–H bond activation of ethylene on Cr–O sites. Catalysis Letters, 144, 805–808. [Crossref] [Google Scholar]
[9] Dye, R. F. (1962). Polymerization process (U.S. Patent No. 3,023,203). U.S. Patent and Trademark Office. https://patents.google.com/patent/US3023203A
[10] Xie, T., McAuley, K. B., Hsu, J. C. C., & Bacon, D. W. (1994). Dynamic modeling of gas-phase ethylene copolymerization in a fluidized-bed reactor. Industrial & Engineering Chemistry Research, 33(3), 449–479. [Crossref] [Google Scholar]
[11] Liu, Y., Zhang, R., Ren, H., Liu, Y., Ling, S., Zhang, H., Liu, B., & Cheng, R. (2020). CrV bimetallic Phillips catalyst prepared by citric acid-assisted impregnation on ethylene polymerization. Macromolecular Chemistry and Physics, 221(11), 2000010. [Crossref] [Google Scholar]
[12] McDaniel, M. P. (2018). A review of the Phillips chromium catalyst for ethylene polymerization. In R. Hoff (Ed.), Handbook of Transition Metal Polymerization Catalysts (Chapter 13). [Crossref] [Google Scholar]
[13] Gholami, F., Pakzad, L., & Behzadfar, E. (2020). Morphological, interfacial and rheological properties in multilayer polymers: A review. Polymer, 208, 122950. [Crossref] [Google Scholar]
[14] Moghaddamzadeh, S., & Rodrigue, D. (2018). Rheological characterization of polyethylene/polyester recycled tire fibers/ground tire rubber composites. Journal of Applied Polymer Science, 135, 46563. [Crossref] [Google Scholar]
[15] Shenoy, A. V., & Saini, D. R. (1986). Melt flow index: More than just a quality control rheological parameter. Part I. Advances in Polymer Technology, 6, 1–58. [Crossref] [Google Scholar]
[16] Rodríguez-Hernández, M. T., Angulo-Sánchez, J. L., & Pérez-Chantaco, A. (2007). Determination of the molecular characteristics of commercial polyethylenes with different architectures and the relation with the melt flow index. Journal of Applied Polymer Science, 104, 1572–1578. [Crossref] [Google Scholar]
[17] Philippe, B., Guy, D., & Mieke, D. (2007). Chromium-based catalysts (European Patent No. EP1845110A1). European Patent Office. https://patents.google.com/patent/EP1845110A1
[18] Kapur, M. J. L., Davis, M. B., & Johnson, L. (2018). Polyethylene composition and articles made therefrom (U.S. Patent No. 9,988,473 B2). U.S. Patent and Trademark Office. https://patents.google.com/patent/US9988473B2
[19] Ashrafi, O., Mostoufi, N., & Sotudeh-Gharebagh, R. (2012). Two-phase steady-state particle size distribution in a gas-phase fluidized bed ethylene polymerization reactor. Chemical Engineering Science, 73, 1–7. [Crossref] [Google Scholar]
[20] Atan, M. F., Hussain, M. A., Abbasi, M. R., Khan, M. J. H., & Fazly Abdul Patah, M. (2019). Advances in mathematical modeling of gas-phase olefin polymerization. Processes, 7(2), 67. [Crossref] [Google Scholar]
[21] Ibrehem, A. S., Hussain, M. A., & Ghasem, N. M. (2008). Mathematical model and advanced control for gas-phase olefin polymerization in fluidized-bed catalytic reactors. Chinese Journal of Chemical Engineering, 16(1), 84–89. [Crossref] [Google Scholar]
[22] Dorresteijn, J. M., Terlingen, B., Bossers, K. W., Jacobs, T. S., Wisse, Y., de Peinder, P., Cirriez, V., Welle, A., Vogt, E. T. C., Meirer, F., & Weckhuysen, B. M. (2025). In-situ thermometry reveals fragmentation behavior based on local temperature in α-olefin polymerization catalysts. Journal of the American Chemical Society, 147(7), 5642–5648. [Crossref] [Google Scholar]
[23] Zhu, H., Lettieri, P., & Materazzi, M. (2025). Systematic analysis of mixing and segregation patterns of binary mixtures in fluidised beds for multi-functional processes. Powder Technology, 449, 120419. [Crossref] [Google Scholar]
[24] Ghasem, N. (2023). Modeling and simulation of a multizone circulating reactor for polyethylene production with internal cooling. Polymers, 15(18), 3741. [Crossref] [Google Scholar]
[25] Ashrafi, O., Nazari-Pouya, H., Mostoufi, N., & Sotudeh-Gharebagh, R. (2008). Particle size distribution in gas-phase polyethylene reactors. Advanced Powder Technology, 19(4), 321–334. [Crossref] [Google Scholar]
[26] Ghasem, N. M. (1999). Effect of polymer particle size and inlet gas temperature on industrial fluidized bed polyethylene reactors. Chemical Engineering Technology, 22(9), 777–783. [Crossref] [Google Scholar]
[27] Harshe, Y. M., Utikar, R. P., & Ranade, V. V. (2004). A computational model for predicting particle size distribution and performance of fluidized bed polypropylene reactor. Chemical Engineering Science, 59(22–23), 5145–5156. [Crossref] [Google Scholar]
[28] Romero, J., & Soares, J. B. P. (2018). A Monte Carlo method to quantify the effect of reactor residence time distribution on polyolefins made with heterogeneous catalysts: Part II – Packing density effects. Macromolecular Reaction Engineering, 12(4), 1800002. [Crossref] [Google Scholar]